By analyzing the supply curve, we noticed that sellers are willing to supply more of a good when its price increases. To switch from a qualitative to a quantitative approach, we will use the concept of price elasticity of supply.
Table de matières
Definition of Price Elasticity of Supply
Price elasticity of supply measures the sensitivity of the quantity supplied of a good to changes in the price of that good; it is the percentage change in the quantity supplied divided by the percentage change in price.
Price Elasticity of Supply and Its Determinants
According to the law of supply, an increase in price leads to an increase in the quantity supplied. Price elasticity of supply measures the sensitivity of the quantity supplied of a good to changes in its price. The supply of a good is said to be elastic if the quantity supplied reacts strongly to price changes. The supply is inelastic if the quantity supplied reacts very little to price changes.
Price elasticity of supply depends on the ability of sellers to modify the quantity of the good offered. For example, the supply of seaside land is inelastic because it is impossible to offer more.
Lire Aussi: Optimisation des stocks en entreprise
On the other hand, manufactured goods, such as books, cars, and televisions, tend to have a more elastic supply because manufacturers can increase the production of their factories if prices rise.
In most markets, time is a determining factor in the price elasticity of supply. Supply is usually more elastic in the long run.
In the short run, companies cannot modify the size of their factories to reduce or increase production. Therefore, in the short run, the quantity supplied is not very responsive to price changes.
Lire Aussi: Understanding EBITDA Calculation
However, in the long run, companies can adjust their production capacity by building new factories or closing older facilities.
Additionally, new firms can enter the market. Consequently, the quantity supplied reacts more to price changes and is, therefore, more elastic in the long run.
Calculating Price Elasticity of Supply
Now that we have a basic understanding of price elasticity of supply, let’s get more specific. Economists calculate price elasticity of supply by dividing the percentage change in the quantity supplied by the percentage change in price:
Lire Aussi: How to Calculate Internal Rate of Return
EP = Percentage change in quantity supplied / Percentage change in price
Let’s consider an example where the price of milk increases from $1.90 to $2.10 per liter, prompting dairy farmers to increase their monthly production from 9,000 to 11,000 liters. Using the midpoint method, we can calculate the percentage change in price as follows:
Percentage change in price = [(2.10 – 1.90) / 2.00] x 100 = 10%
Similarly, we can calculate the percentage change in the quantity supplied:
Percentage change in quantity supplied = [(11,000 – 9,000) / 10,000] x 100 = 20%
In this example, the price elasticity of supply is:
Price elasticity of supply = 20% / 10% = 2
An elasticity of 2 indicates that the quantity supplied reacts proportionally twice as much as the price.
The Diversity of Supply Curves
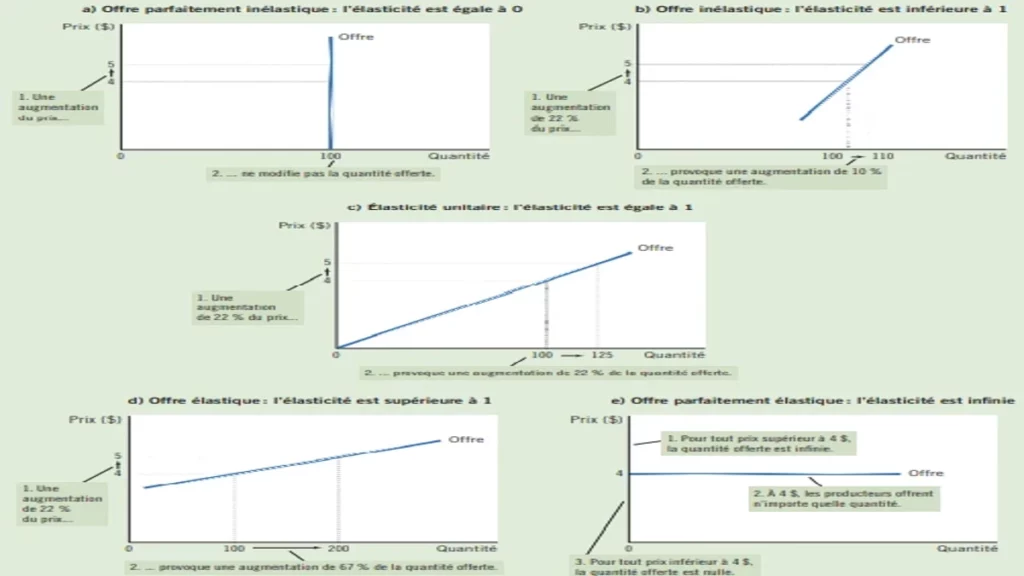
Since price elasticity of supply measures the sensitivity of the quantity supplied to price changes, it is reflected in the shape of the supply curve. Figure 1 below illustrates five different cases.
In the extreme case of zero elasticity, supply is perfectly inelastic, and the supply curve is vertical (graph a). In this case, the quantity supplied remains the same regardless of the price. As elasticity increases, the supply curve flattens, indicating that the quantity supplied reacts more and more to price changes (graphs b, c, and d). At the other extreme, supply is perfectly elastic. This occurs when the price elasticity of supply approaches infinity, and the supply curve is horizontal (graph e), indicating that slight price changes lead to huge variations in the quantity supplied.

Note that all percentage changes have been calculated using the midpoint method.
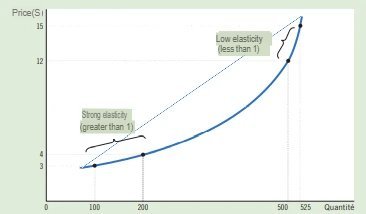
In some markets, the elasticity of supply is not constant and varies along the supply curve. Figure 2 below illustrates a specific case in an industry where the production capacity of firms is limited.
As long as the quantity supplied remains low, the price elasticity of supply is high, indicating that firms react strongly to price changes.
In this section of the curve, some production capacity remains unused, and factories and equipment are not operating at full capacity throughout the day.
A slight increase in price makes it profitable to utilize this excess capacity. However, as production increases, firms reach their full production capacity, and any further increase in production would require the construction of new factories.
But before firms undertake such investments, prices would need to increase substantially, making supply less elastic.
Figure 2 illustrates this phenomenon. When the price increases from $3 to $4 (a 29% increase, according to the midpoint method), the quantity supplied increases from 100 to 200 units (a 67% increase). The quantity supplied varies proportionally more than the price, and the elasticity of supply is greater than 1.
On the other hand, when the price increases from $12 to $15 (a 22% increase), the quantity supplied only increases from 500 to 525 units (a 5% increase).
In this case, the quantity supplied increases proportionally less than the price, and the elasticity is less than 1.

[Figure 2: Illustration of the variations in price elasticity of supply]


